Who Should Contribute to Funding of Global Health R&D and How Much?
The international community recently gave WHO a mandate to advance global health R&D by creating a pooled international fund for a first set of four Demonstration Projects. Mari Grepstad, Suerie Moon and John-Arne Røttingen consider how it could be funded.
This May, the 67th World Health Assembly (WHA) made important progress on strengthening research and development (R&D) of medicines and other technologies for diseases that affect the world’s poor by agreeing to establish an international fund for R&D. The fund builds on the 2012 report of the WHO Consultative Expert Working Group on Research and Development (CEWG), which recommended a framework for more sustainable and equitable financing of R&D that aims to “de-link” innovation costs from product prices through approaches such as open knowledge innovation and prizes (see an earlier blog post).
WHO has been mandated to take forward at least four projects selected by Member States and experts to apply these new approaches to neglected diseases such as Cutaneous and Visceral leishmaniasis, present in the Americas, Middle East, Africa, Central Asia, Mediterranean and southern U.S. Seen as a step towards demonstrating the opportunities of de-linkage models, this move was warmly welcomed by international NGOs.
A recent report commissioned by the Drugs for Neglected Diseases initiative (DNDi) suggests guiding principles, policies and governance arrangements for the pilot fund. The fund would mobilize and deploy resources with assistance from independent advisory committees, and could be governed by a Board hosted by an existing organisation. The WHA asked WHO to examine the feasibility of establishing the fund at the Special Programme for Research and Training in Tropical Diseases (TDR).
Estimates suggest that the four Demonstration Projects would cost about 60 million USD over five years. How should we split the bill?

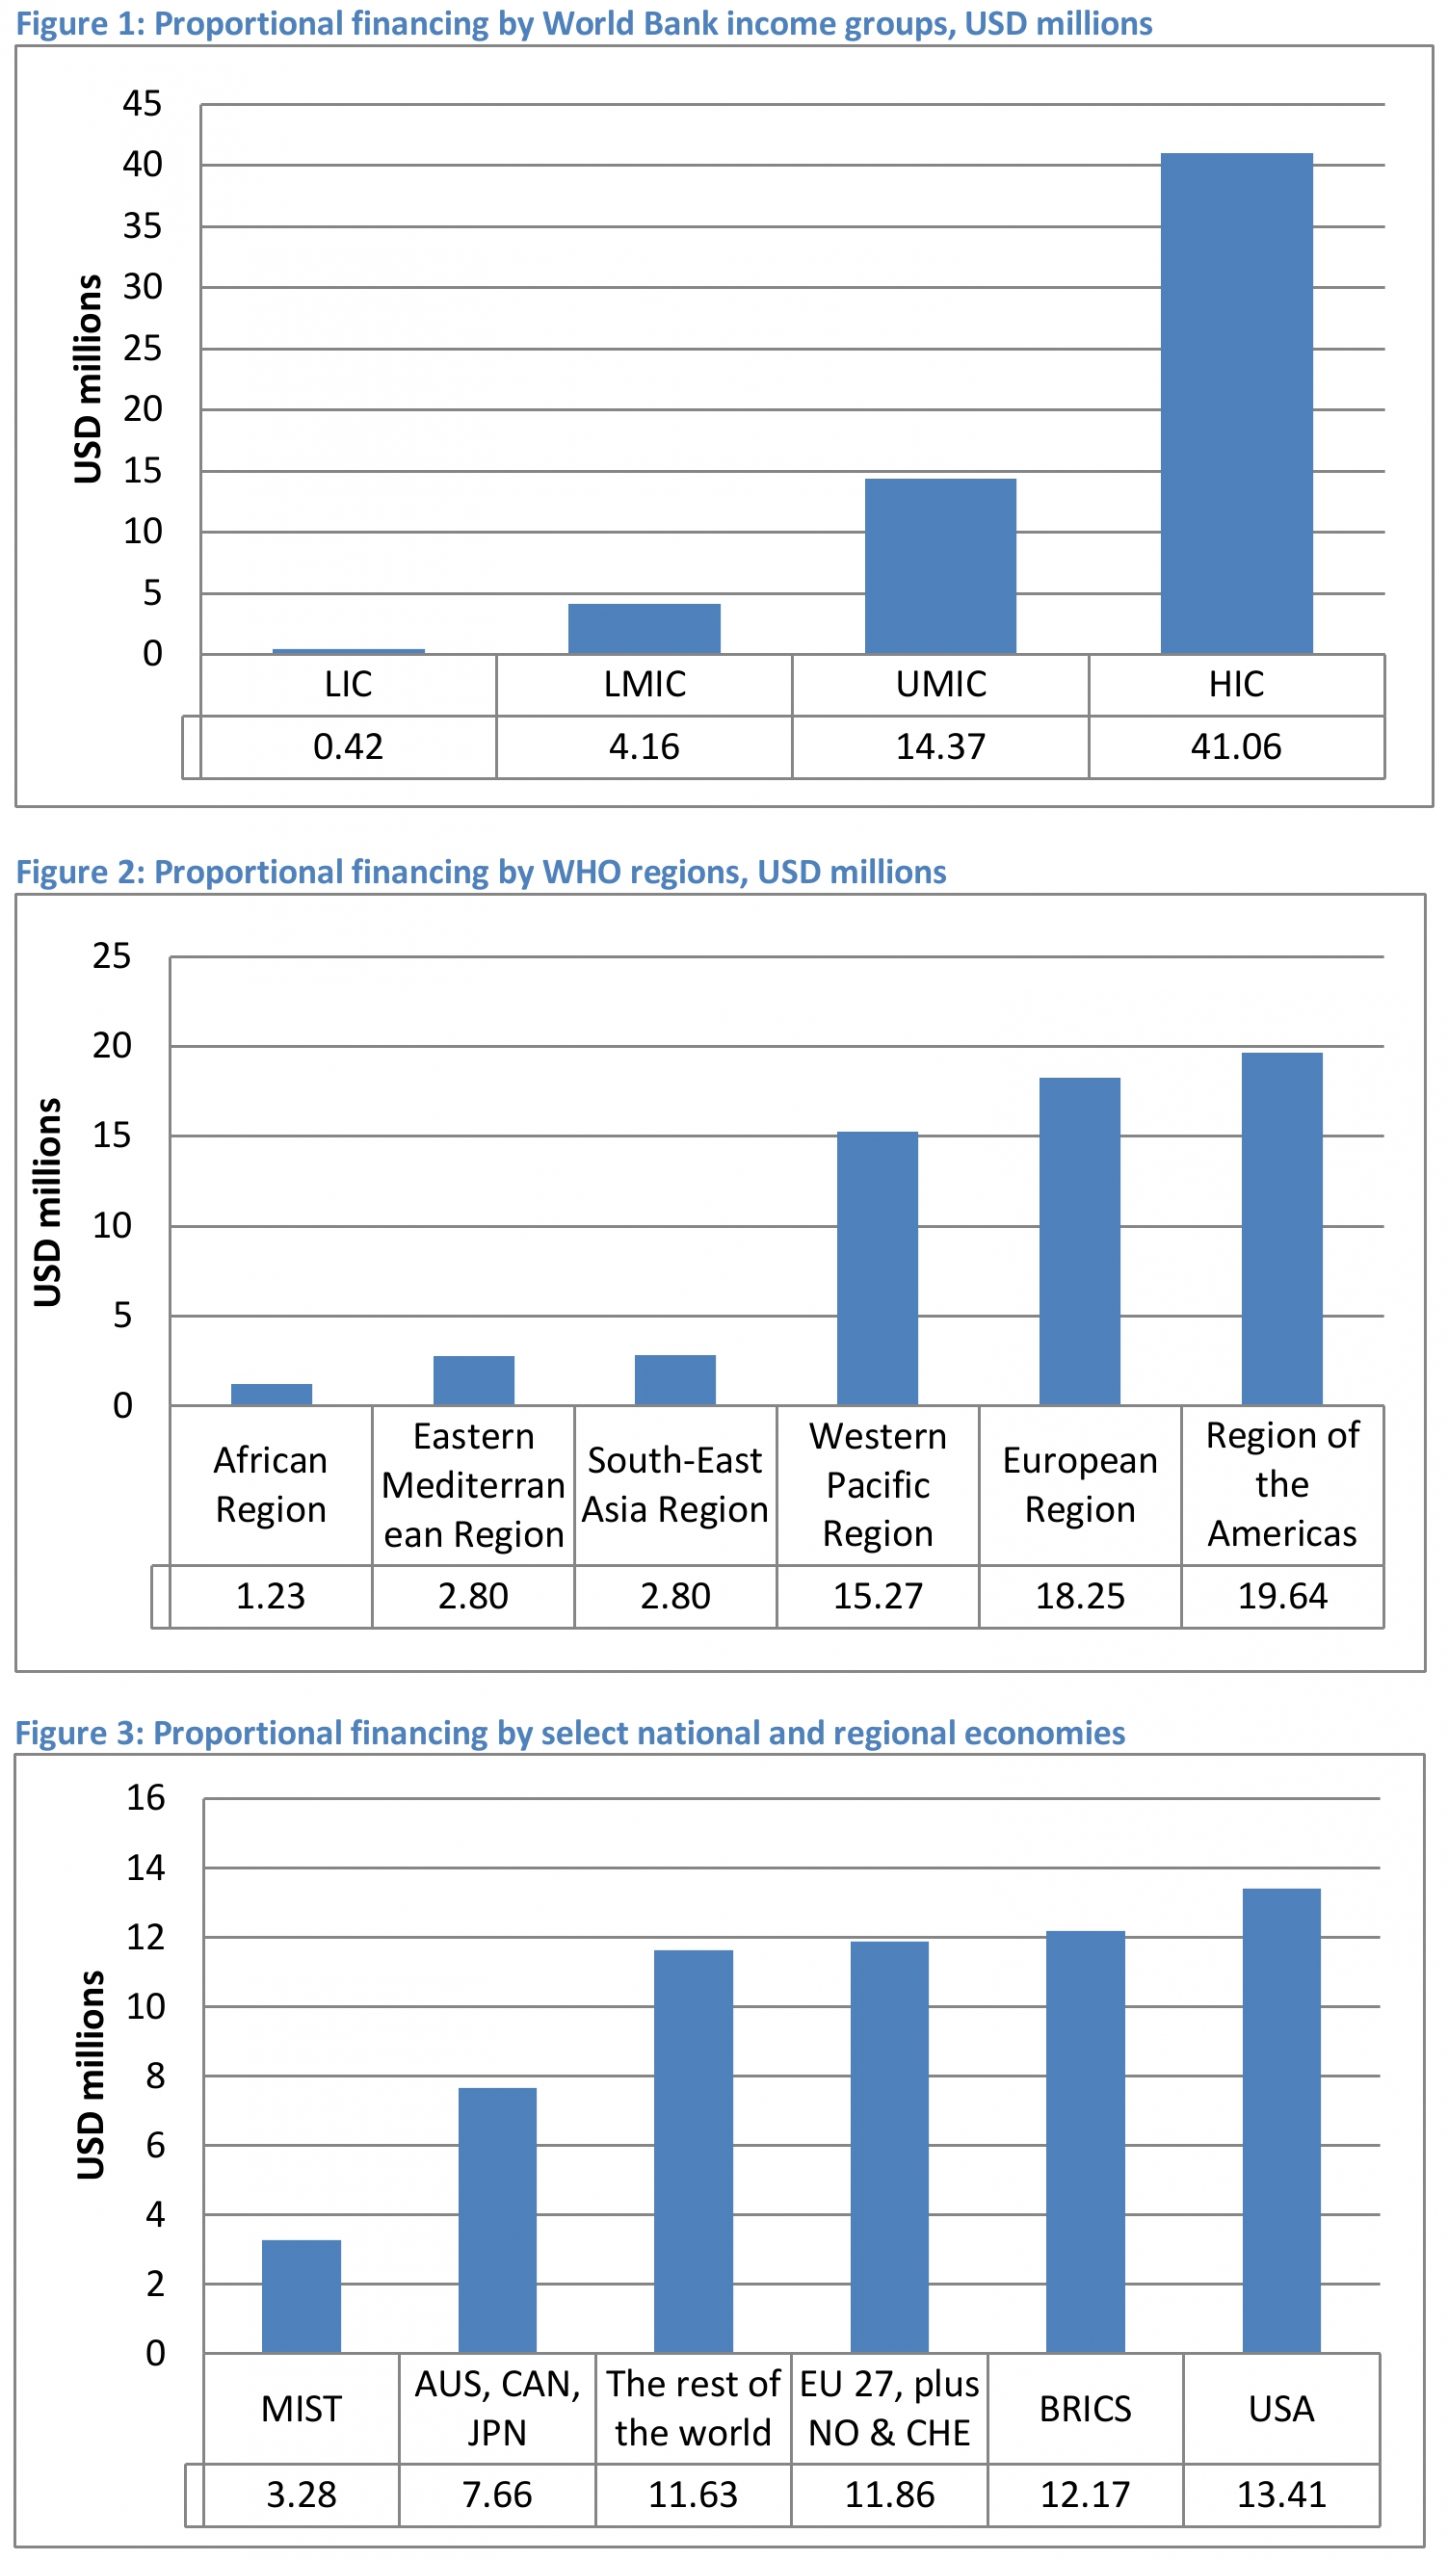
AUS: Australia; BRICS: Brazil, Russia, India, China and South Africa; CAN: Canada; CHE: Switzerland; EU: European Union; JPN: Japan; MIST: Mexico, Indonesia, South Korea and Turkey; NOR: Norway; USA: United States of America
Global health R&D financing should reflect the principles of sustainability and equity. We have explored cost-sharing following the CEWG’s recommendations that contributions should be proportional to a country’s share of global GDP, considered a useful measure for contributions to global public goods. Using 2012 data, we estimated contributions by geographic and economic groups.
By dividing the total cost of $60m between World Bank income groups (Figure 1), low income countries combined would pay a total of $0.42m (0.7%), lower middle income countries $4.16m (6.9%), upper middle income countries $14.37m (23.9%) and high income countries $41.06m (68.4%) over five years.
Dividing contributions by WHO regions rather than income-group would yield contributions ranging from $1.23m to $2.80m for each of the African, Eastern Mediterranean and South-East Asia regions, and ranging from $15.27m to $19.64m for the Western Pacific, European and American regions (Figure 2).
Finally, dividing the cost among large established and emerging economies (Figure 3) suggests that there are substantial contributions to be made by the BRICS (Brazil, Russia, India, China and South Africa) countries (USD 12.17m/20.3%) with smaller contributions coming from the MIST (Mexico, Indonesia, South Korea and Turkey) countries (USD 3.28m/5.5%). Nevertheless, important investments are still required from Western countries, with the US being allocated the largest share at USD 13.41m (22.4%).
While the Demonstration Projects need to demonstrate far more than just financing arrangements, the potential implications of a new approach to financing global health R&D are big. When commercial markets are inadequate, specific measures are needed to secure sustainable financing for innovation. Ambassadors will attend a pledging meeting in Geneva in late September to discuss what contributions their countries can make. This meeting will be an important litmus test of political will: if a broad base of countries commits to make financial contributions this could signal a new way to share the costs of R&D in a globally equitable manner.
Figure notes: Data in figures 1 and 3 were retrieved from World Bank Data http://data.worldbank.org/data-catalog/GDP-ranking-table. Data in figure 2 were retrieved from http://apps.who.int/nha/database/Select/Indicators/en. In figure 1, each income groups’ share of financing was calculated based on the aggregated GDP of all income groups. In figure 3, the GDP of the category “the rest of the world” was calculated by subtracting the other categories from World Bank’s estimated GDP for the World. This means that the reference GDP (the GDP of the world) is different in figure 1 and 3 (USD 72 725 856m vs USD 72 681 982m).
Mari Grepstad is an adviser at the Norwegian Institute of Public Health. Suerie Moon is Research Director and Co-Chair of the Forum on Global Governance for Health at the Harvard Global Health Institute. John-Arne Røttingen was the chair of the WHO Consultative Expert Working Group on Research and Development, and is Director of the Division of Infectious Disease Control, Norwegian Institute of Public Health and Adjunct Professor at the University of Oslo and the Harvard School of Public Health.
Potential competing interests: SM is a member of the Board of Directors of the Drugs for Neglected Diseases initiative-North America. JAR is the Chair of the Board of the Alliance for Health Policy and Systems Research.

[…] a new article in PLOS, global health experts write on how the international community can fund global health R&D projects. After the World Health Assembly meeting last May, four demonstration projects were selected by […]
[…] priority for the UN? EPHA: mHealth – an essential component towards integrated care LSHTM: Who Should Contribute to Funding of Global Health R&D and How Much? MHealth News: Top 5 mHealth News stories of the summer MHealth News: How can ‘patient […]